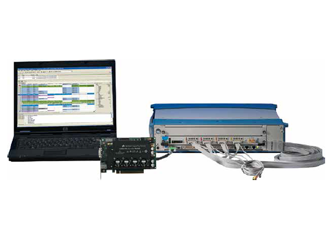
| 하드웨어 |
|
- 2.5GT/s(Gen1), 5.0GT/s(Gen2) 및 8.0GT/s(Gen3) 속도
- x1 ~ x16 링크 폭 지원
- x1 ~ x8 양방향 8GB 캡처, x16 양방향 최대 16GB 캡처
- CEM 슬롯, M.2(M-key), SFF-8639 PCIe 인터포저, PCIe Gen3 미드버스 프로브, 플라잉 리드
|
| 데이터 보기 및 탐색 |
|
- 유연한 컬러링의 패킷 뷰어, 패킷 유형 또는 방향별 컬러
- 버스의 실제 데이터(헤더, 페이로드)를 표시하기 위해 패킷을 강조한 레인 보기
- 단순한 패킷 필터, 신속한 검색 및 자동 계산
- 하나의 보기를 빠르게 클릭하면 다른 보기의 같은 지점으로 곧 이동할 수 있도록 모든 보기 전반에 걸쳐 상관관계 구축
|
| 분석 툴 |
|
- 등화 분석을 포함한 LTSSM 개요는 링크 트레이닝 프로세스를 검증하고 장애 원인을 식별하는 데 유용합니다.
- 상세한 트래픽 패턴 분석 및 그래프 작성이 포함된 트래픽 개요
- 활용, 처리율, 응답 시간, 지연 측정을 통한 성능 분석(흐름 제어 분석 포함)
- 데이터 개요를 포함한 데이터 분석을 통해 PCIe, NVMe, AHCI의 트랜잭션 디코딩 구현
|
|
사용이 간편하고 강력한 상태 기반 트리거링
|
|
- 사용이 간편한 필터와 트리거
- 복잡한 시나리오 분석을 위한 고급 트리거링(예: 완료 누락)
|
|
Decoding and Analyzing PCIe Traffic
|
|
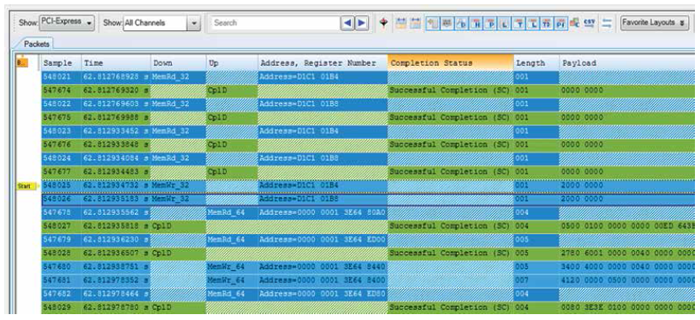
- This spreadsheet view gives you quick and easy access to your favorite views of PCIe packets
|
|
Decoding and Analyzing PCIe Traffic
|
|
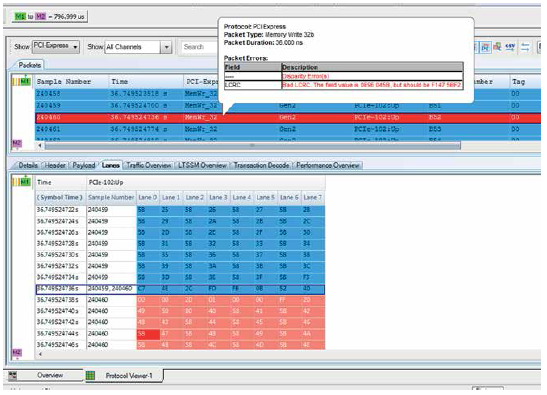
- Here a Memory Read packet has a bad LCRC and is directly tied to the Lane view shows which byte and which lane has been corrupted.
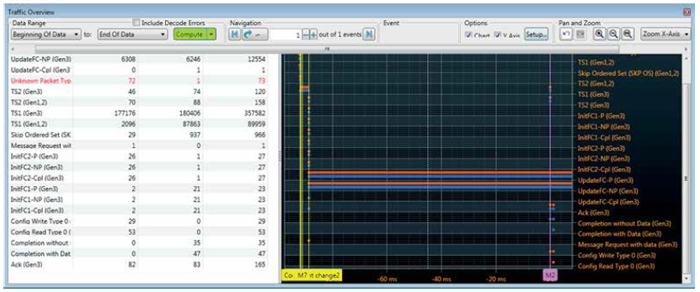
- The Traffic Overview shows all of the packets in the capture buffer in a time scale display. Instantly access to any packet by clicking on the graph.
|
|
Powerful PCIe triggers
|
|
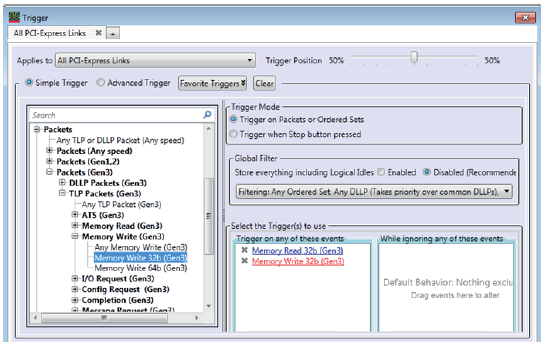
- Trigger on Memory Read or Memory Write packet and center the capture buffer around either of these packets.
|
|
NVMe data
|
|
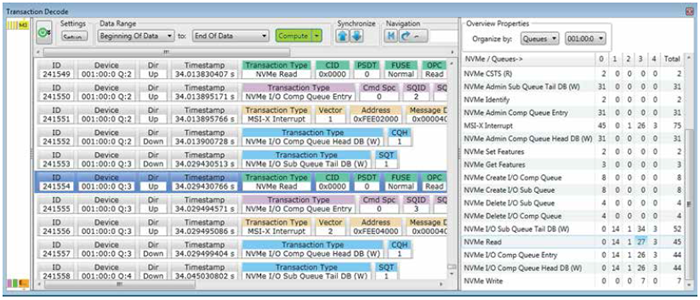
- NVMe transaction information provides easy to understand displays of NVMe payloads and PRP messages. Transaction overview of all transactions enables instant access to all messages in the capture trace.
|
|
AHCI data
|
|
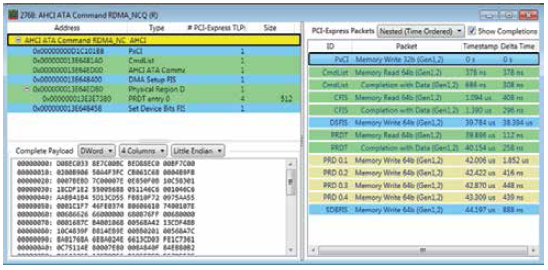
- View AHCI transaction displayed in the Transaction Decode tab as a super transaction to visualize its complete set of related transactions.
|
|
LTSSM
|
|
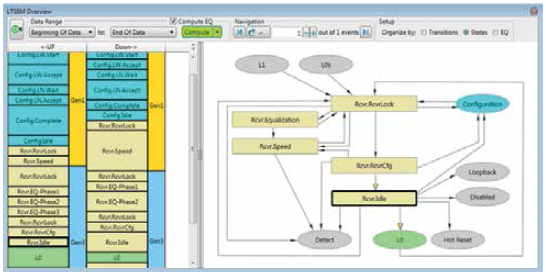
- LTSSM diagrams show the state transitions and training flow of the link. Deep dive into the trace with packet synchronization.
|
|
Equalization (EQ) analysis
|
|
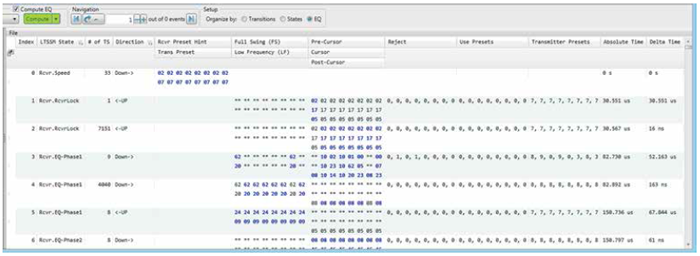
- Quickly identify the changing equalization settings for each lane, with the values highlighted in blue.
|
|
Performance Analysis
|
|
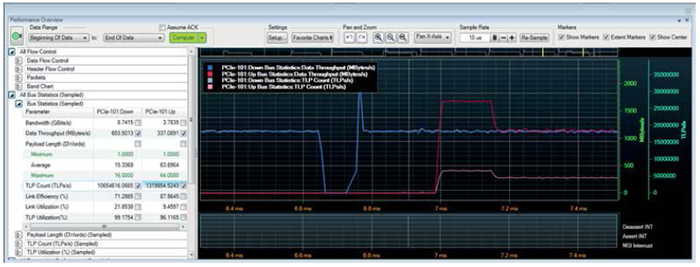
- The statistical performance of the link latency, utilization, Flow Control credits, is shown with events such as Interrupts and errors.
|
|
Flow Control Analysis
|
|
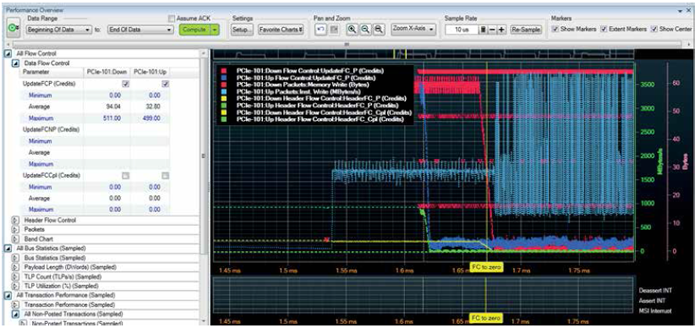
- Easily identify credit exhaustion with flow control analysis for data and header flow control analysis.
|